

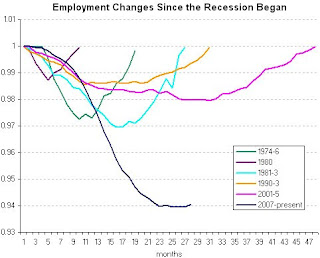
Since the recession began in December 2007, the US economy has had a net loss of about 5.24% of its non-farm payroll jobs.
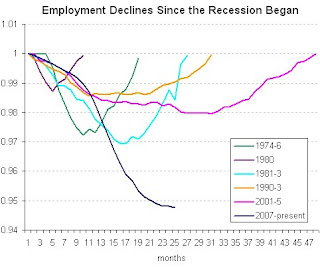
In terms of percentage job losses from the start of the employment recession (December 2007), this recession is the worst recession since WWII and 2nd worst in terms of the unemployment rate (only early '80s recession with a peak of 10.8 percent was worse).
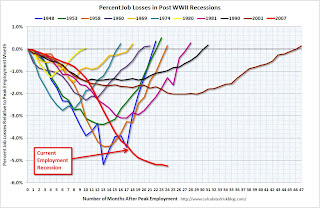
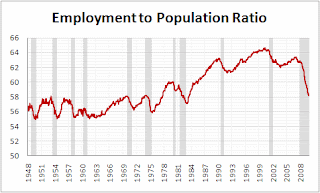
The unemployment rate is appearing to be stabilizing at around 10% in the last few months not due to any significant improvements in the job market but due to considerable numbers dropping out of the labor force. The erosion of the labor force since May has totaled 1.9 million people, with a fall of 661,000 in December alone.

Reflective of this trend, the employment-population ratio (employed Americans to the adult population) — which doesn’t get distorted by whether someone is officially or unofficially unemployed — dropped to 58.2% from 58.5% in November, the lowest since 1983.
Government payrolls are up 0.44% relative to their pre-recession levels, while private nonfarm payrolls have fallen steadily and is now 6.34% below pre-recession levels.
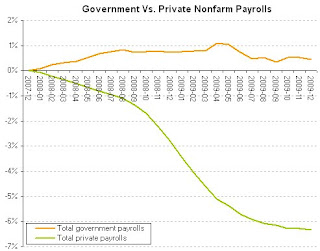
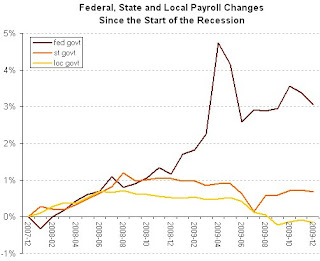
Government workers at the local level have been less secure than their counterparts in state and federal government, as indicated in their decline of 0.15% since the recession began. Federal and state payrolls are up 3.06% and 0.68% respectively.
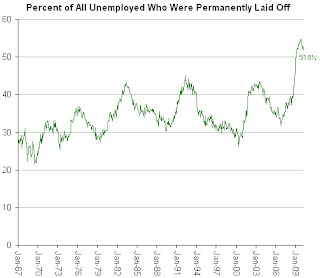
A record 6.13 million workers or 4.0% of the civilian workforce have been unemployed for more than 26 weeks and still want a job, the highest since records started in 1948. The average duration of unemployment reached 29 weeks in December, the longest since the government began tracking such data in 1948.

The number of persons employed part time for economic reasons (sometimes referred to as involuntary part-time workers) was about unchanged at 9.2 million in December and has been relatively flat since March.

Greg Mankiw has been tracking the unemployment rate in relation to the unemployment forecasts that were made when the ARRA was formulated

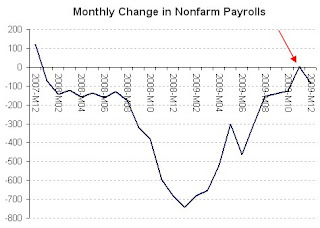
The three month moving average of employment changes, which is a more representative reflection of the underlying trends, indicates that the declines are slowly coming to an end.

The increase in job losses after the gain of November does raise the spectre of a double-dip (W-shaped) recession, though it may be too early to speculate so much.
Update 1
See this from Economix explaining the growing problem of long term unemployed.
Update 2
A Historical Look at the Labor Market During Recessions from the Dallas Fed.
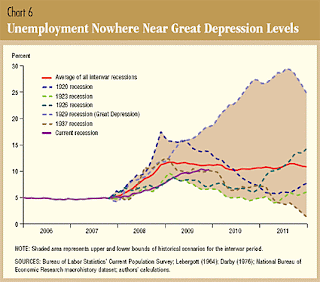
However, among post-war recessions, the current one is the worst for unemployment increase.

Update 3
Catherine Rampell feels that "compared with previous recessions, many more of the employment gains in this recovery will have to come from new jobs", since "many of the jobs slashed during this recession are not coming back". Thia would mean that many of the Americans who are already out of work are likely to stay in that miserable state for a long, long time and the underclass will increase considerably.
Update 4
The US economy lost 20000 jobs in January as the unemployment rate unexpectedly dipped to 9.7 percent, from 10 percent in December. Since the recession began in December 2007, the US economy has lost 8.4 million jobs.
More reports here - the unemployment report is more encouraging than expected; for the first time in recorded history, women outnumber men on the nation’s non-farm payroll jobs; more employers appear to be converting their part-time employees back to full-time workers; since the recession began in December 2007, the economy has had a net loss of about 6.1 percent of its nonfarm payroll jobs; the average length of time jobless people have been out of work is at an all-time high of 30.2 weeks.
Update 5
As on January 2010, 6.3 million people had been unmeployed for more than 27 weeks. While black men form only 5.5% of the workdforce, they make up 13.3% of the long-term unemployed. More than 15 million people are officially jobless.

Update 6 (3/4/2010)
After losing eight million jobs across US since the recession began in December 2007, payrolls finally surged in March, as employers added 162,000 nonfarm jobs and nationwide the unemployment rate held steady at 9.7%. Since the economy needs to add more than 100,000 jobs a month just to absorb new entrants into the labor market, let alone provide a livelihood for the 15 million Americans already looking for work, the CBO has projected that unemployment rate will hover around 10% for the rest of the year.
See this on long-term unempoyment figures.

The chart below shows job changes in this recession compared to recent ones, with the blue line representing the current downturn. The line has ticked upward, but still has a long way to go before the job market fully recovers to its pre-recession level. Since the downturn began in December 2007, the economy has shed about 5.9 percent of its nonfarm payroll jobs.
No comments:
Post a Comment